Two readers wrote in after the last article on the “over-softening” myth, and both raised questions worth answering with more depth…the first asked about whether the sodium/potassium a softener adds to the water is a direct function of how much hardness it is removing. The second focused on the interaction between plants and ion-exchange softened water.
Both are getting at the same underlying issue from different angles, and the answer is that it depends less on which decade you bought your softener and more on how hard your water was to begin with, along with which part of the plant the water touches. Today’s equipment fixed a real problem from the old days, but it did not change the underlying chemistry, and the underlying chemistry is what actually determines whether softened water belongs on a landscape.
The exchange math does not bend
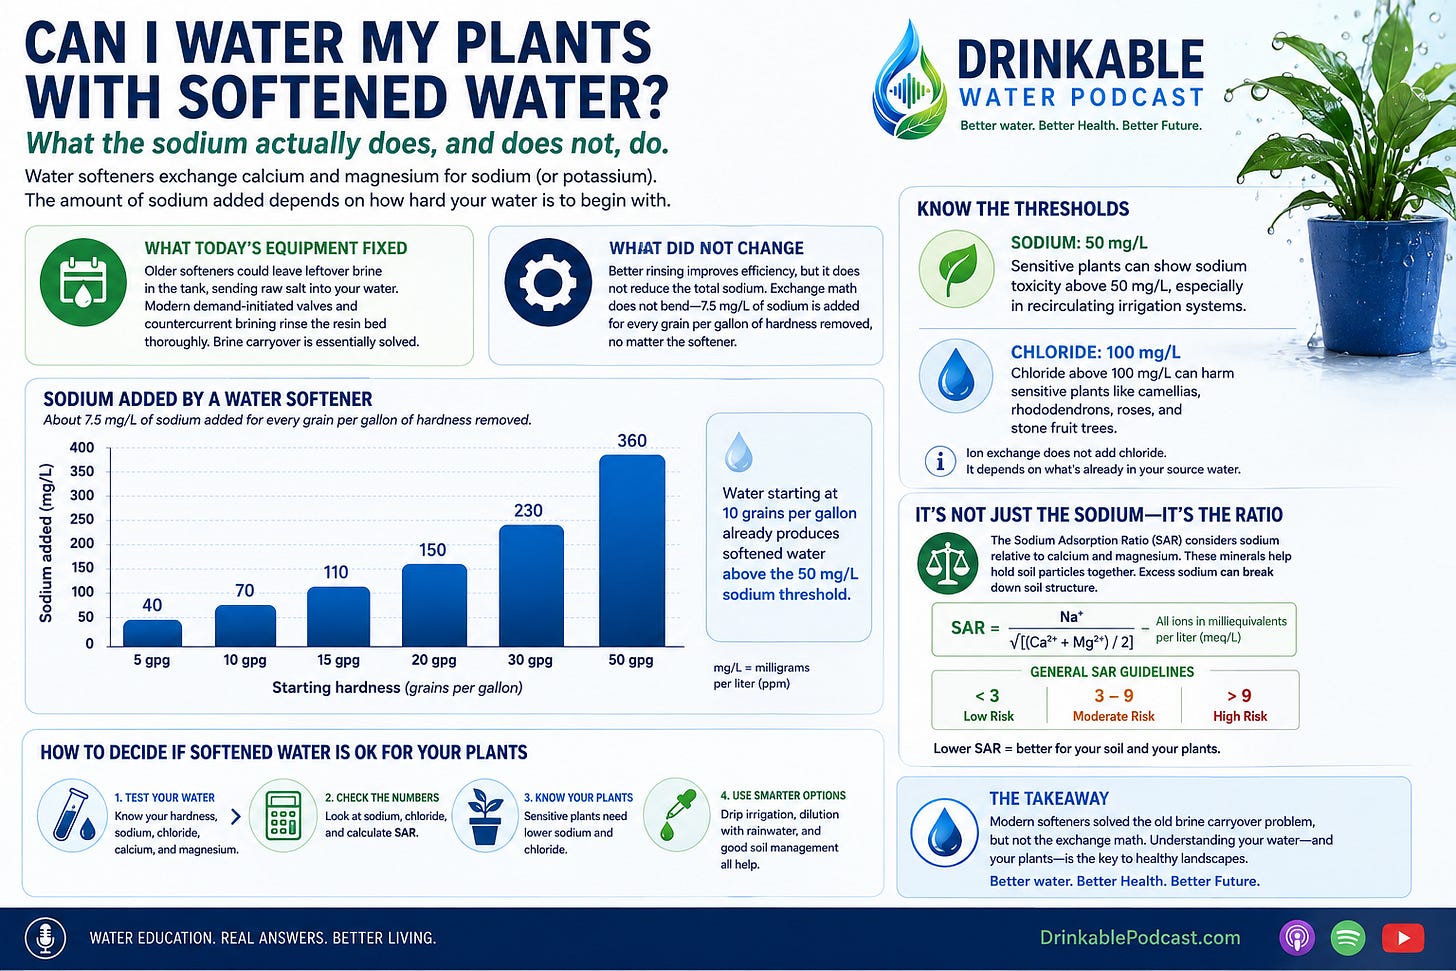
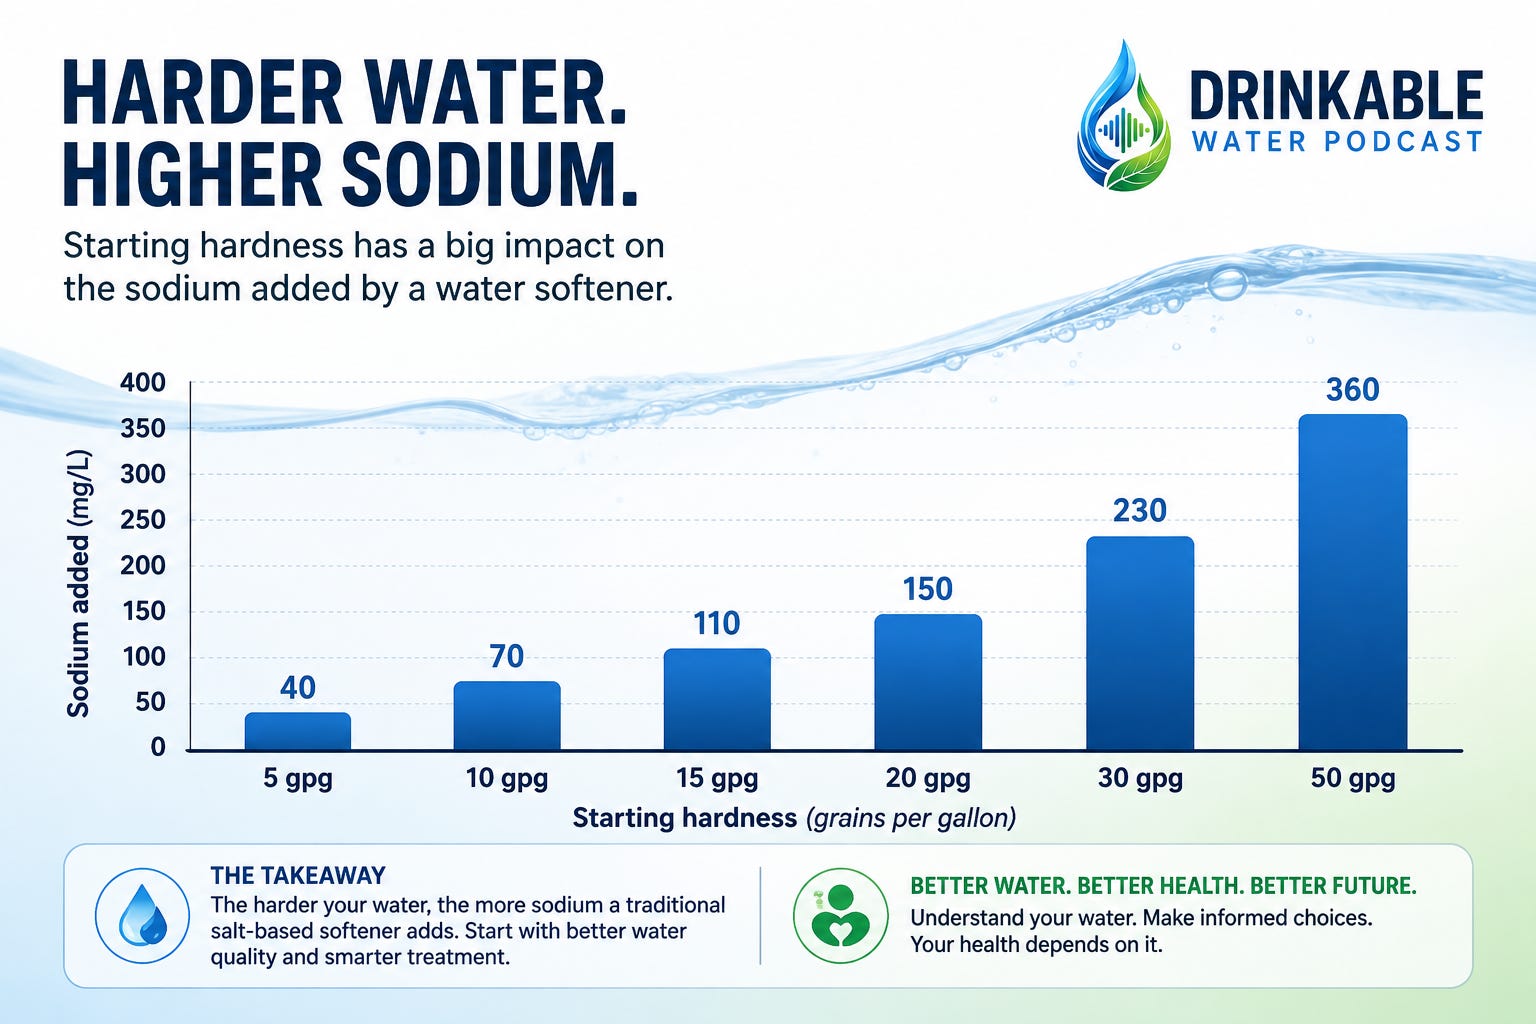
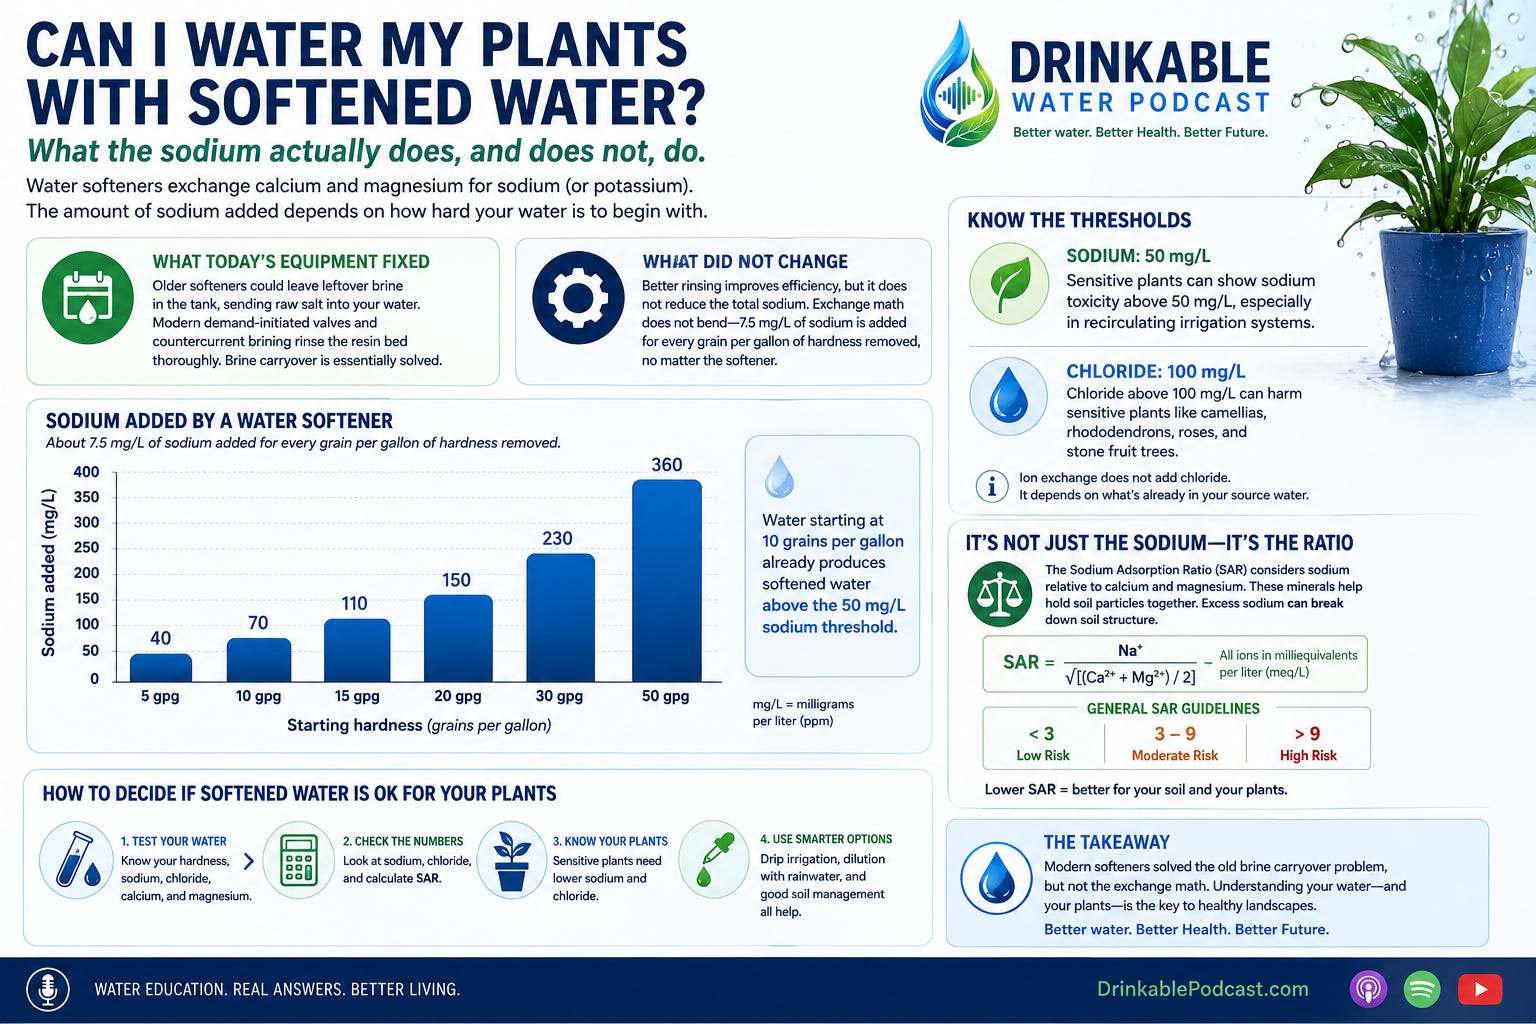
Ion exchange trades calcium and magnesium for sodium (or potassium) on an equivalent basis. The resin does not know or care whether the water started at 5 or 55 grains per gallon. It swaps one equivalent of hardness for one equivalent of sodium each time. The average is about 7.5 milligrams per liter of sodium added for every grain per gallon of hardness removed.
The chart below shows what that looks like across a normal range of starting hardness, from a moderately soft municipal supply at 5 grains up to 50 grains per gallon.
What today’s equipment has improved upon
In the old days, mechanical-timer driven softeners with downflow (co-current) brining often did not always rinse the resin bed thoroughly. That could leave a noticeable slug of leftover regeneration byproducts sitting in the tank, ready to slip into the first few gallons of service water after regeneration. If you watered plants with that water, you were not only giving them the sodium that had been exchanged for hardness, you were giving them a dose of raw salt riding along on top of it. That was a relatively common phenomenon, and it is a legitimate reason why softened water from an older softener could hurt a landscape far more than the underlying hardness numbers alone would suggest.
Modern demand initiated regeneration electronically-timed valves and countercurrent brining rinse the resin bed far more completely. That old brine carryover problem is essentially solved in a properly installed, well maintained system. What reaches the tap today is the sodium that was actually exchanged for hardness, paired with whatever anions (usually bicarbonate, sometimes sulfate or chloride) that were already present in the raw water to begin with.
Better rinsing eliminates wasted salt and brine carryover. It does not reduce the total sodium load in the treated water, because that quantity is fixed by the exchange stoichiometry, the same 7.5 milligrams per liter per grain regardless of how efficient the valve is, or how well it rinses. A perfectly rinsed modern softener treating 50 grain well water still adds roughly 375 milligrams of sodium per liter.
Where the thresholds sit
Agricultural Extension research generally treats 50 mg/L of sodium as the point where sensitive plants can begin showing sodium toxicity, particularly in recirculating irrigation systems. Look at what that means against our chart above. Water starting at 10 grains per gallon, which describes a large share of municipal supplies across the country, already produces softened water above that 50 milligram threshold.
A separate but related threshold applies to chloride. Extension research on ornamental plant production generally flags chloride concentrations above 100 milligrams per liter as a concern for sensitive woody ornamentals, including camellias, rhododendrons, roses, and stone fruit trees. Chloride is not something a softener adds directly, since ion exchange softening does not touch anions, but it is worth knowing that some source waters already carry meaningful chloride from the aquifer or municipal supply, and softening does nothing to lower that level.
Understanding the sodium adsorption ratio properly
Raw sodium concentration alone is not the most complete way to evaluate irrigation water, because calcium and magnesium in the same water partly offset the risk that sodium poses to soil structure. This is what the sodium adsorption ratio, usually abbreviated SAR, is built to capture. The formula is the sodium concentration divided by the square root of half the sum of the calcium and magnesium concentrations, with all three measured in milliequivalents per liter rather than milligrams per liter or parts per million.
The reason the ratio matters more than the raw number is straightforward. Calcium and magnesium physically hold soil particles together. Sodium, in sufficient relative concentration, displaces them from that role. A water sample with high sodium and also high calcium and magnesium poses less structural risk than a sample with the same sodium level and very little calcium or magnesium to compete against it. This is precisely why softened water deserves additional scrutiny rather than being judged on sodium content alone. A softener does not just add sodium, it simultaneously removes the calcium and magnesium that would have otherwise offset that sodium in the SAR calculation. Ion exchange softening pushes the ratio in the wrong direction from both sides at once.
As a general guide, water with a SAR:
- below 3 is considered safe for turf and most common ornamental landscape plants.
- Between roughly 3 and 9, expect a growing likelihood of permeability problems, especially in fine textured soils such as clay and silty loam, with coarser sandy soils tolerating higher values before showing damage.
- Above 9, and certainly once a water sample or a soil sample crosses a SAR of 13, expect real and often visible soil structure problems.
Soil scientists apply a parallel measurement directly to the soil itself called the exchangeable sodium percentage, or ESP, which measures what share of the soil’s total cation exchange capacity is occupied by sodium rather than calcium, magnesium, or potassium. A soil is generally classified as sodic once ESP exceeds 15%, and problems with water infiltration and aeration typically begin well before that threshold is reached, worsening gradually as the ESP climbs rather than appearing suddenly at one fixed number.
Permanent plantings vs. vegetables
The SAR guidance above was largely developed for agricultural irrigation, and a lot of it gets quoted as though a single number applies equally to every kind of planting. It’s just not that simple. Annual crops and vegetable beds get a kind of reset every season, through tillage, fresh soil amendment, and a root system that only occupies that ground for a few months before it is replaced. Permanent plantings, specimen trees, foundation shrubs, hedgerows, and turf that is never tilled, do not get that environmental reset. Sodium adsorption onto soil exchange sites is a cumulative equilibrium, not something that clears itself between waterings, so the same water that looks acceptable for a single season of tomatoes can still cause real, visible damage to an established tree after several years of repeated exposure.
Part of the reason is where the sodium ends up physically. A tree’s fine feeder roots occupy the same few inches of topsoil year after year, and that is exactly where dissolved salts concentrate when irrigation water evaporates and transpires. This is why Ag. extension and arborist literature consistently recommends periodic leaching irrigation for permanent landscape plantings on marginal water (applying a larger volume of good quality water than the plant strictly needs on a given day) specifically to push accumulated salts down past the root zone rather than letting them concentrate there. Skipping that periodic leaching is the single most common reason a softened or moderately saline irrigation source looks fine for years and then suddenly does not.
Two different gardens
Two soils receiving identical irrigation water do not necessarily degrade at the same rate, and the reason comes down to how much calcium and magnesium the soil itself already holds in reserve. That reserve, sitting on the soil’s own cation exchange sites and in its mineral fraction, is what added sodium has to compete against before it can do any damage.
A soil with substantial native calcium carbonate, common through much of the calcareous, limestone influenced ground across the Mountain West, carries a built in buffer. As sodium tries to occupy exchange sites, calcium continues dissolving out of that mineral reserve to compete for the same sites, keeping the effective exchangeable sodium percentage lower for a given sodium input than a soil without that reserve would show. A sandy soil with low overall cation exchange capacity behaves differently again, since it simply has fewer total exchange sites to begin with and drains quickly, giving sodium less opportunity to accumulate in the first place.
This is precisely why identical softened irrigation water can be fine in one yard and damaging two streets over. The water is the same, but the soil underneath it is not. A soil test that reports calcium, magnesium, and cation exchange capacity alongside sodium gives an actual picture specific to that piece of ground, rather than relying on the water’s SAR number in isolation to predict an outcome that depends just as much on what is already in the soil.
Utah State University Extension has tracked sodic soils as a documented and increasingly common problem across the state’s valley floors, tracing back to a 2010 fact sheet on the subject and updated as recently as 2023. The pattern extension agronomists describe is that these soils tend to show up in the lower, flatter areas of a valley, where a naturally high water table over many years concentrated sodium near the surface long before anyone irrigated with either well water or a home softener. A homeowner in one of those lower valley locations is not just dealing with whatever sodium the irrigation water itself contributes. They may already be starting from a soil that carries a real, pre-existing sodicity burden, which is exactly the kind of detail a soil test surfaces and a SAR number on the water report alone cannot.
There is a second, less obvious factor working against that calcium reserve in hot, arid, or poorly drained conditions, and it is worth exploring because it explains why the same water often causes more damage in exactly the climates where irrigation is needed the most. As water is lost from the root zone, whether through direct surface evaporation, capillary rise to the surface, or plant uptake that draws water into the roots while leaving the great majority of dissolved ions behind, the remaining soil solution becomes progressively more concentrated. Minerals precipitate out of that concentrating solution in a predictable order, driven by solubility rather than by which ions happen to be adjacent. Calcium carbonate is the least soluble and precipitates first, followed by calcium sulfate (gypsum) at a somewhat higher concentration. Sodium chloride is considerably more soluble than either and stays dissolved much longer. Calcium chloride is even more soluble.
The practical consequence is that evaporative concentration in soil pulls calcium out of solution early (as calcite or gypsum) while leaving sodium behind in solution and available to occupy exchange sites once the calcium competition has already precipitated out. This is exactly why the pale crust that forms on the surface of a poorly drained, heavily irrigated bed in an arid climate is typically dominated by sodium salts rather than calcium salts, and it means the soil’s calcium buffer is not a fixed, static reserve. The calcium buffer actively depletes faster under exactly the hot, dry, high evapotranspiration conditions where irrigation is doing the most work, which is one more reason permanent plantings in arid climates deserve more caution with marginal water than the same SAR number might suggest for a cooler, wetter location.
How sodium and chloride can hurt a landscape
It is worth separating this into three distinct mechanisms, because they operate on different timelines and respond to different fixes.
- The first is structural, in the soil. Calcium and magnesium hold soil aggregates together by bridging negatively charged clay particles. When sodium builds up and displaces those ions, the clay particles lose that bridging and begin to repel each other instead (dispersion). The aggregates fall apart, pore space collapses, and both water infiltration and root zone aeration decline. This is slow and cumulative rather than immediate, which is part of why it gets dismissed until a lawn or bed is already struggling and a soil test finally explains why.
- The second is osmotic, in the root zone. Elevated sodium and general salinity raise the concentration of dissolved salts in the soil solution surrounding plant roots. That raises the osmotic pressure of the soil water relative to the water inside root cells, making it physically harder for roots to draw water out of the soil even when the ground is visibly moist. This condition is sometimes described as physiological drought, since the plant shows drought stress symptoms while standing in wet soil, because the gradient that normally pulls water into the roots is working against it rather than for it.
- The third is direct foliar toxicity, and it only applies when water touches the leaves rather than only the soil, which happens with overhead sprinkler irrigation but not with drip irrigation or hand watering at the base of a plant. Leaves can absorb sodium and chloride directly through the surface, and in sensitive species that absorption produces marginal scorch and leaf drop starting with the older foliage. Camellias, rhododendrons, azaleas, roses, stone fruit trees, dogwood, hackberry, and ginkgo are commonly cited as particularly sensitive to this kind of foliar injury from sodium or chloride, while many turfgrasses and a number of common landscape shrubs tolerate substantially higher levels before showing damage. A homeowner with sensitive ornamentals can often continue using higher sodium water safely simply by switching from an overhead sprinkler to drip irrigation, since drip delivers water to the root zone without ever contacting the foliage.
Drip irrigation solves the foliar contact problem, but it is not a blanket fix for salt exposure in general. Water moving out from a drip emitter forms a wetted bulb in the soil. As that bulb dries between irrigations, salts concentrate at its outer edges. This means that salt can build up right at the surface directly above a plant’s root zone, and particularly at the boundary between two adjacent emitters, which is exactly where a plant’s roots are most likely to be if it happens to sit midway between them. Drip is still the better choice for sodium or chloride sensitive ornamentals, since it removes the foliar exposure entirely, but it works best paired with attention to emitter placement and occasional leaching, not as a substitute for either.
There is one more variable worth knowing about if the local climate includes real seasonal rainfall, since it cuts in a counterintuitive direction. Rainfall carries essentially no dissolved salt, and water that low in overall salinity can itself promote clay dispersion at the soil surface, meaning the SAR threshold that is safe for a given soil actually gets stricter, not looser, during and after a period of meaningful rain.
A water source that looks fine by SAR alone in a dry month can become more of a soil structure risk right after a wet one, which is one more reason a single SAR number on a water test should not be treated as a permanent, one-time verdict.
What to do about it
For most municipal water in the 5 to 15 grain range, softened water used occasionally on a potted plant or a garden bed is unlikely to cause meaningful harm, particularly with drip irrigation. For harder waters, or on water where there is already an elevated basel-level of sodium, even intermittent soft water irrigation would not be a good ides.
Regardless of the influent hardness or sodium levels, here are some best practices:
- Plumb outdoor spigots and irrigation lines ahead of the softener, so hard water goes to the landscape and softened water stays inside the house.
- Consider potassium chloride as the regenerant salt for any home where softened water does end up reaching plants occasionally. Potassium does not carry the same soil structure risk as sodium, and it functions as a plant nutrient in its own right rather than a liability.
- Switch overhead sprinklers to drip irrigation for sodium or chloride sensitive ornamentals, since foliar contact rather than soil chemistry alone is what triggers the visible leaf scorch in those species.
Have soil tested if a landscape has been irrigated with softened or naturally high sodium water for years, and treat the amendment choice as a diagnosis rather than a default. Gypsum (calcium sulfate) is the standard first response, since it dissolves readily enough to put usable free calcium into the soil solution on a practical timescale, unlike native limestone, which is calcium carbonate and is just too poorly soluble to release meaningful calcium into solution on its own.
Organic matter and compost help by adding total cation exchange capacity to the soil, so that a given sodium load represents a smaller share of the total exchange complex.
None of these amendments do anything on their own without a genuine leaching event afterward, since sodium has to be physically flushed downward and out of the root zone with real water volume, and testing again a few months later is the only way to confirm an amendment actually worked rather than assuming it did. It is also worth resisting the urge to over-amend, since adding more gypsum than a soil test calls for raises the soil’s overall salinity and can require yet more leaching to correct.
This is precisely the kind of nuance a WQA Master Water Specialist is trained to walk a homeowner through, matching the softener setup and the irrigation plan to both the house and the yard rather than treating every gallon leaving the resin tank the same way, and rather than giving a blanket yes or no to a question that genuinely depends on the numbers.
What a great time to be in the water business!
Further reading
Penn State Extension. (2022). Interpreting Irrigation Water Tests. Penn State College of Agricultural Sciences.
Ayers, R. S., and Westcot, D. W. (1985). Water Quality for Agriculture. FAO Irrigation and Drainage Paper 29. United Nations Food and Agriculture Organization.
Rutgers New Jersey Agricultural Experiment Station. FS893: Evaluating Water Quality for Ornamental Plant Production.
University of California Statewide Integrated Pest Management Program. Nutrient and Mineral Excesses, Salinity, and Salt Toxicity. UC IPM Home and Landscape.
USDA Natural Resources Conservation Service. Testing and Interpreting Salt Affected Water for Tree and Shrub Plantings. Plant Materials Technical Note MT 61.
Oregon State University Extension Service. Managing Salt Affected Soils for Crop Production. PNW 601.
University of Georgia Agricultural and Environmental Services Laboratories. Soil Salinity Testing, Data Interpretation, and Recommendations.
Colorado State University Extension. Diagnosing Saline and Sodic Soil Problems.
Barker, B., Cardon, G., Yost, M., Stock, M., Creech, E., and Gale, J. (2023). Managing Saline and Sodic Soils and Irrigation Water. Utah State University Extension. Peer-reviewed fact sheet.
James, D. W. (2010). Sodic Soils Are Occurring More Frequently in Utah. How Should They Be Managed? Utah State University Extension.
Utah State University Extension. Managing Soil pH for Crop Production in Calcareous-Alkaline Soil.
New Hampshire Department of Environmental Services. (2020). DWGB-3-17: Sodium and Chloride in Drinking Water.
Water Technology Report. (2016). Improving Softener Efficiency: How to Reduce the Environmental Impact of Salt Discharge.
U.S. Environmental Protection Agency. (1988). Ambient Water Quality Criteria for Chloride. EPA 440/5-88-001. Office of Water, Washington, DC.
Elphick, J. R., Bergh, K. D., and Bailey, H. C. (2011). “Chronic toxicity of chloride to freshwater species: Effects of hardness and implications for water quality guidelines.” Environmental Toxicology and Chemistry, 30(1).
Hardie, L. A., and Eugster, H. P. (1970). “The evolution of closed-basin brines.” Mineralogical Society of America Special Paper, 3.