A quick word before we get into the math. Everything below reflects established water treatment engineering principles, but scaling behavior is never purely theoretical. It depends on actual operating temperature, hydrodynamics, membrane characteristics, recovery rate, and feedwater that inevitably varies from one season to the next. Treat what follows as a working framework, not a final design answer.
Before committing to a system configuration, run the numbers through current manufacturer projection software, like DuPont’s FilmTec design tool, and confirm against your own lab data and site conditions.
In 1936, a University of California, Berkeley chemist named Wilfred Langelier was trying to solve a very practical problem for municipal water systems: why did some pipes and boilers clog with mineral deposits while others corroded down to bare metal, and could the same water do both depending on how you treated it? His answer, published in the Journal of the American Water Works Association, gave the industry the Langelier Saturation Index (LSI), a tool so useful that we are still teaching it in almost exactly the same form ninety years later. If you are servicing reverse osmosis systems, water heaters, or industrial cooling loops, you are living inside Langelier’s math every single day, whether you realize it or not.
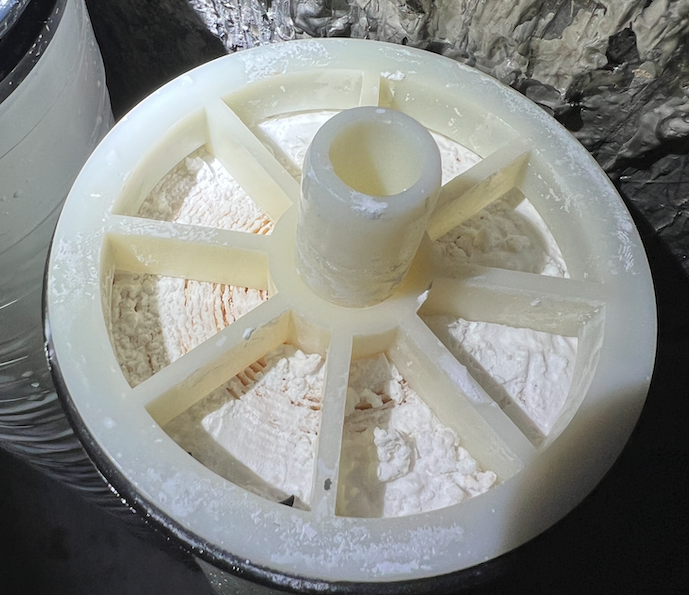
Scaling is what happens when a sparingly soluble salt exceeds its capacity to stay dissolved and precipitates out onto whatever surface is nearby: a membrane, a heat exchanger tube, the inside of a boiler, the element in a water heater.
Once that deposit starts forming, it reduces flow, increases pressure drop, and shortens the service life of the equipment underneath it. Are you servicing systems that keep losing flux for no obvious reason? There is a very good chance the answer is sitting in the water analysis, not in the hardware.
The thermodynamics of a deposit
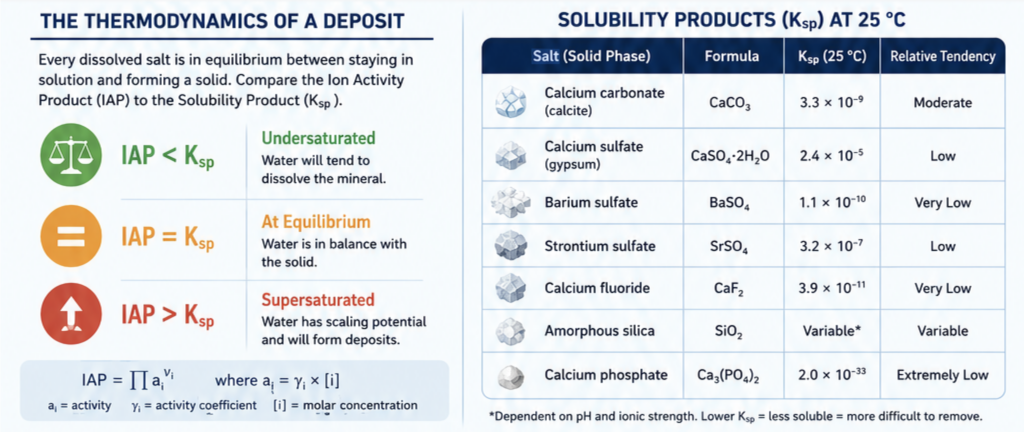
Every dissolved salt in water exists in a kind of ongoing negotiation between staying in solution and forming a solid. Chemists describe that negotiation with two numbers. The Ion Activity Product, or IAP, describes the actual condition of the water: it is the product of the activities of the relevant ions, each raised to its stoichiometric coefficient. The Solubility Product, or Ksp, is a fixed constant for a given salt at a given temperature, describing the point of equilibrium for that salt in pure water.
Compare the two and you get an answer to the only question that actually matters for scale prevention:
If IAP is less than Ksp, the water is undersaturated and will tend to dissolve that mineral rather than deposit it.
If IAP equals Ksp, the water sits at equilibrium.
If IAP is greater than Ksp, the water is supersaturated, and you have scaling potential.
Notice how many orders of magnitude separate calcium sulfate from calcium phosphate or barium sulfate. That range tells you why some scales form fast and reversibly while others, once they set, are nearly impossible to remove chemically.
Barium sulfate in particular is notorious among industrial water treatment people for exactly this reason: its Ksp is small enough that even trace barium and sulfate concentrations can exceed it, and the resulting scale is highly resistant against most of the acid-based cleaners that we would normally use.
Gypsum and the saturation ratio approach
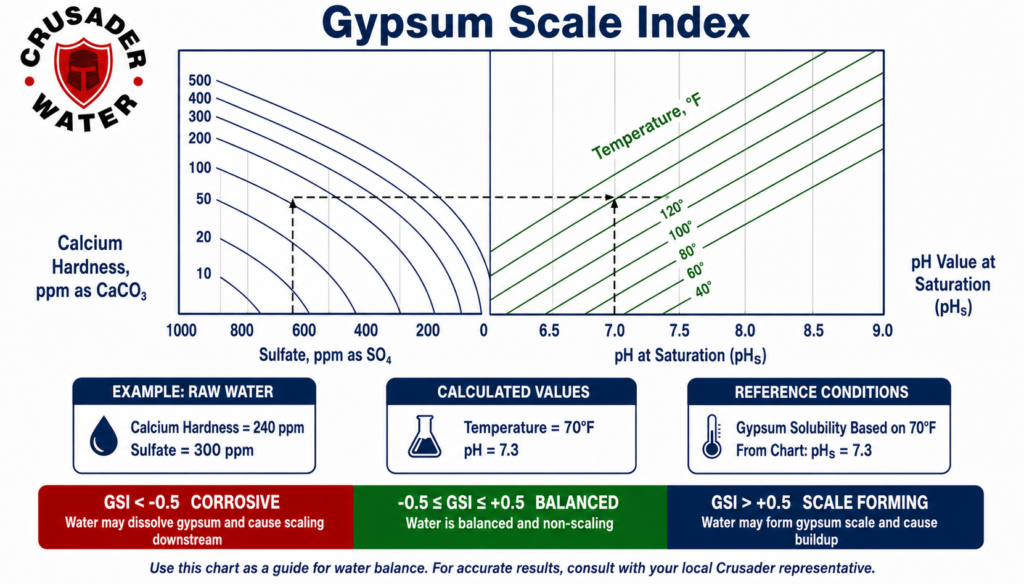
Calcium sulfate deserves its own treatment because the IAP versus Ksp comparison gets expressed a little differently in daily reverse osmosis practice. The saturation ratio, SR, is simply the IAP divided by Ksp, using activity-corrected concentrations of calcium and sulfate:
Most RO system projections aim to keep the concentrate stream’s gypsum SR somewhere below roughly 1.5 to 2.3 when a properly matched antiscalant is running in the dosing skid, though the exact ceiling shifts with temperature, recovery, and the specific antiscalant chemistry in use.
Remember that acid dosing, which works so well for calcium carbonate control, does almost nothing for gypsum. Sulfate salts do not respond to pH the way carbonates do, so the tools that actually move the needle here are antiscalant chemistry, reduced recovery, or softening ahead of the membrane.
One more thing catches people off guard: concentration polarization at the membrane surface itself can push the local SR meaningfully higher than the bulk concentrate number ever suggests, which is exactly why a bulk-stream calculation alone is not enough for a system running close to its limits.
Getting from a water analysis to a real answer
A lab report gives you results in mg/L. None of the scaling math works until you convert those numbers into molar concentrations, so the first practical step is unit conversion. For a simple ion, molar concentration in mol/L equals the mg/L value divided by the molecular weight in grams per mole. For alkalinity or hardness reported as CaCO3, you divide the ppm value by 50 to get milliequivalents per liter, since 50 g/eq is the equivalent weight of calcium carbonate.
Once you have molar concentrations, you still are not quite at the IAP, because real water does not behave like an ideal dilute solution. Dissolved ions interact with each other and with water molecules, and that interaction changes their effective concentration, called activity. The activity coefficient, gamma, corrects for this, and for ionic strengths under about 0.5 mol/kg, it is commonly estimated with the Davies equation, which relates gamma to the ion’s charge and the total ionic strength of the solution. If you skip this step, you will consistently overstate scaling risk in any water with meaningful total dissolved solids, which is most of the water our industry actually treats.
Here’s a worked example that shows how it comes together.
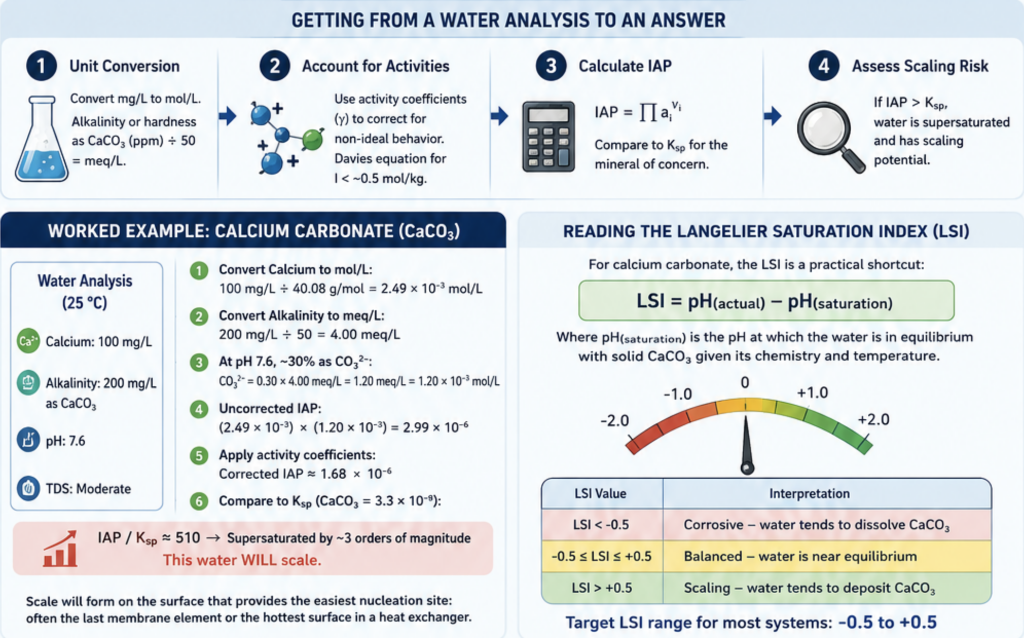
That water will scale, and it will scale on whatever surface gives it the easiest place to nucleate, which in practice tends to be the last membrane element in the array or the hottest surface in a heat exchanger. Run this same math against your projected concentrate composition, not just the raw feed, since recovery concentrates every one of these ions well beyond what shows up on the feedwater analysis.
Reading the Langelier Saturation Index
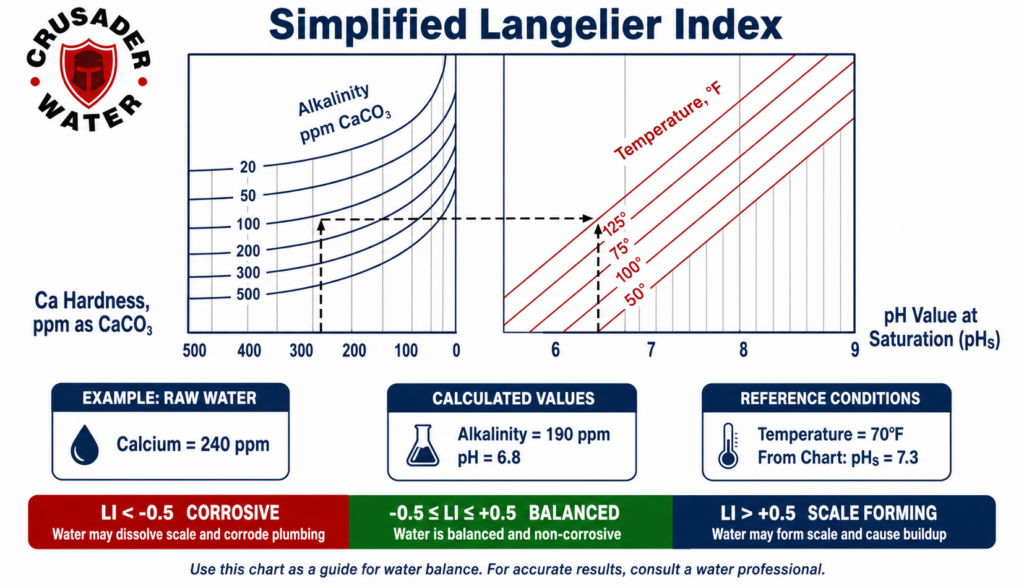
For calcium carbonate specifically, the industry generally does not walk through the full IAP versus Ksp comparison every time. Instead we use Langelier’s shortcut, the LSI, defined as the difference between the actual measured pH of the water and the saturation pH, the pH at which that water would sit in equilibrium with solid calcium carbonate given its actual calcium, alkalinity, and TDS.
LSI = pH(actual) minus pH(saturation)
A positive LSI means the water is supersaturated with calcium carbonate and tends toward scaling. An LSI of zero means the water sits at equilibrium. A negative LSI means the water is undersaturated and tends toward corrosion instead, since it will aggressively seek calcium carbonate wherever it can find it, including the protective scale layer already sitting inside your pipes.
Calculating the saturation pH itself uses a formula built from four terms:
pH(saturation) = (9.3 + A + B) minus (C + D)
A is derived from total dissolved solids, B from water temperature, C from calcium hardness as CaCO3, and D from total alkalinity as CaCO3. Each term shifts the saturation point in a direction that matches basic chemistry intuition: higher temperature, higher hardness, and higher alkalinity all push the saturation pH down, which pushes LSI up and increases scaling tendency. Higher TDS does something similar through its effect on ionic strength.
Where the science gets honest about its limits
The LSI earns its ninety-year lifespan because it is simple and it works well for the case Langelier actually built it for: predicting calcium carbonate behavior in relatively dilute municipal water. Where the field runs into trouble is applying it outside that case without acknowledging the limits. The LSI says nothing about barium sulfate, strontium sulfate, silica, or calcium phosphate scaling, each of which follows its own Ksp and can be the dominant scaling risk in industrial or high-recovery reverse osmosis applications even when the LSI for calcium carbonate looks perfectly benign. For high-TDS feedwater, particularly above about 10,000 mg/L, the Stiff and Davis Stability Index generally does a better job than the LSI because it accounts for ionic strength effects the original Langelier formulation was never built to handle.
Remember that LSI, like every saturation index, tells you the thermodynamic driving force, not the rate of scale formation. Supersaturated water does not necessarily scale immediately, and the presence of sequestrants, the surface characteristics of the membrane or pipe, cross-flow velocity, and axial flux all influence how fast a thermodynamic tendency becomes a physical deposit. Treating LSI as a precise predictive number rather than a directional indicator is a common mistake, and it is one that gets expensive when someone designs a system right at the edge of the acceptable range with no operating margin.
Keeping the numbers where they belong
For most reverse osmosis systems, the practical guidelines that keep a plant out of trouble look something like this. Keep LSI between negative 0.5 and positive 0.5. Keep the 15 minute Silt Density Index under 5, and preferably at 3 or below. Screen feedwater for calcium as CaCO3 under 250 mg/L. Watch sulfate as SO4 2- and keep it under 250 mg/L to avoid gypsum scaling. Keep silica as SiO2 under 150 mg/L to manage membrane fouling risk. Hold pH in the 6.5 to 8.5 range for optimum stability.
Treat every one of those numbers as a starting screen rather than a final design figure. Run the actual system through current manufacturer projection software and confirm against your own site data before committing to a configuration.
When feedwater chemistry pushes past those numbers, a handful of proven strategies bring it back under control:
Control pH through acid addition or CO2 dosing to shift the carbonate equilibrium away from precipitation.
Add scale inhibitors, typically phosphonates or polyacrylates, that interfere with crystal nucleation and growth even in supersaturated conditions.
Soften the water through ion exchange or membrane pretreatment to remove hardness before it ever reaches the point of concern.
Reduce system recovery to increase feed flow and dilute the concentrate stream.
Maintain proper cross-flow velocity and control axial flux to reduce the concentration boundary layer at the membrane surface.
Monitor consistently and track trends over time rather than reacting only after a problem shows up.
That second item, scale inhibition through phosphonate or polyacrylate chemistry, deserves a specific mention because it is where a lot of dealers get the dosing wrong. A well-formulated phosphate-based inhibitor, dosed correctly in the 0.25 to 1.5 ppm range, keeps calcium and magnesium in solution well past the point where an untreated system would already be depositing scale, without doing the job of a softener. That is not a substitute for good system design, but it buys real margin against feedwater variability, which matters because feedwater rarely stays as consistent as the day you commissioned the system.
Why this is a certified-people problem, not just a certified-products problem
None of this math means anything if the person running the calculation does not understand where the numbers come from or when the shortcut formula stops applying. I have watched technically sound equipment fail in the field because someone plugged numbers into an LSI calculator without understanding that the water in front of them had a silica or barium problem the calcium carbonate index was never going to catch. That is not a hardware failure, it is a training failure, and it is exactly what the Water Quality Association is working to fix.
This is why WQA certification matters as much as it does, across the full credential range from CI and CST through CSD, CWS, and MWS. A certified professional is demonstrating that they understand not just how to run a calculation, but when that calculation applies and when it does not. Pair that with certified products, tested and verified against real performance standards rather than marketing claims, and you get systems that actually perform the way the water analysis says they should. If you are a homeowner or a facility manager trying to find someone who actually understands this chemistry, find.wqa.org is where you start.
Further reading
Davies, C. W. (1962). Ion association. Butterworths.
DuPont Water Solutions. (2023). FilmTec reverse osmosis membranes: Technical manual. DuPont de Nemours, Inc.
Langelier, W. F. (1936). The analytical control of anti-corrosion water treatment. Journal – American Water Works Association, 28(10), 1500-1521.
Stumm, W., & Morgan, J. J. (1996). Aquatic chemistry: Chemical equilibria and rates in natural waters (3rd ed.). Wiley-Interscience.